Articles
- Page Path
- HOME > J Trauma Inj > Volume 36(3); 2023 > Article
-
Original Article
Relationship between sonorheometry parameters and laboratory values in a critical care setting in Italy: a retrospective cohort study -
Antonio Romanelli, MD1
 , Renato Gammaldi, MD1, Alessandro Calicchio, MD2, Salvatore Palmese, MD1, Antonio Siglioccolo, MD1
 -
Journal of Trauma and Injury 2023;36(3):210-216.
DOI: https://doi.org/10.20408/jti.2023.0014
Published online: July 4, 2023
- 994 Views
- 36 Download
1Department of Anesthesia and Intensive Care Unit, Azienda Ospedaliero Universitaria San Giovanni di Dio Ruggi d’Aragona, Salerno, Italy
2Department of Anesthesia and Intensive Care, University of Naples Federico II, Naples, Italy
- Correspondence to Antonio Romanelli, MD Department of Anesthesia and Intensive Care Unit, Azienda Ospedaliero Universitaria San Giovanni di Dio Ruggi d’Aragona, Via San Leonardo, Salerno 84131, Italy Tel: +39-089-6711 Email: antonioromanelli86@gmail.com
Copyright © 2023 The Korean Society of Traumatology
This is an Open Access article distributed under the terms of the Creative Commons Attribution Non-Commercial License (http://creativecommons.org/licenses/by-nc/4.0/) which permits unrestricted non-commercial use, distribution, and reproduction in any medium, provided the original work is properly cited.
ABSTRACT
-
Purpose
- This preliminary retrospective cohort study analyzed the relationship between the parameters provided by sonorheometry device Quantra and the coagulation values obtained from standard venous blood samples in patients admitted in intensive care unit (ICU).
-
Methods
- We reviewed medical charts of 13 ICU adult patients in whom at least one coagulation study with Quantra was performed. The relationship between Quantra and laboratory data was analyzed with the Spearman rank correlation coefficient (rho). The 95% confidence interval (CI) was computed. A P-value <0.05 was considered statistically significant.
-
Results
- We collected 28 data pairs. Statistically significant moderate correlations were found for the following parameters: clot time (CT) and activated partial thromboplastin time (rho=0.516; 95% CI, 0.123–0.904; P=0.009; clot stiffness (CS) and the international normalized ratio (INR; rho=0.418; 95% CI, 0.042–0.787; P=0.039); INR and platelet contribution to CS (rho=0.459; 95% CI, 0.077–0.836; P=0.022); platelet count and platelet contribution to CS (PCS; rho=0.498; 95% CI, 0.166–0.825; P=0.008); and fibrinogen and fibrinogen contribution to CS (FCS; rho=0.620; 95% CI, 0.081–0.881; P=0.001).
-
Conclusions
- Quantra can provide useful information regarding coagulation status, showing modest correlations with the parameters obtained from laboratory tests. During diffuse bleeding, CT and FCS values can guide the proper administration of clotting factors and fibrinogens. However, the correlation of INR with CS and PCS can cause misinterpretation. Further studies are needed to clarify the relationship between Quantra parameters and laboratory tests in the critical care setting and the role of sonorheometry in guiding targeted therapies and improving outcomes.
- Background
- Coagulation disorders are common in the intensive care unit (ICU) and are related to adverse clinical outcomes [1–3]. In the ICU, coagulation parameters are typically monitored using venous blood samples and the proper therapeutic strategy is adjusted according to the results. However, obtaining blood venous samples is a time-consuming procedure, and the results require several minutes before clinical availability.
- The use of whole blood viscoelastic testing (VET) surmounts these limitations, allowing quick corrections with the adoption of the proper therapeutic strategy, especially in urgent cases or emergencies [4]. TEG (Haemonetics Corp) and ROTEM (Tem Instrumental GmbH) are the most common VET devices, consisting of a pin suspended in a cup of blood, one of which oscillates. When coagulation begins, the clot connects the pin and the cup, and the pin’s movement becomes coupled with that of the cup (or vice versa if it is the pin rotating). The displacement can be displayed graphically [5], and its magnitude is referred to as the “clot amplitude” or “clot firmness,” representing the strength of the clot connecting the pin and cup. However, in these VET devices, the applied mechanical stress is strong enough to alter the clot formation [6], invalidating the exact variable value the devices are trying to measure.
- Quantra (HemoSonics), a VET device based on sonic estimation of elasticity via resonance (SEER) or sonorheometry technology [7], uses high-frequency ultrasound pulses to quantify the shear modulus—a parameter that describes the elastic properties of solid material—of a blood sample during the process of coagulation, without interference with clot formation [8,9]. SEER has been studied in different surgical settings, such as cardiac and major surgery [10–16], with encouraging results and good correlations with common VET devices and laboratory tests. However, patients requiring ICU admission represent a heterogeneous population completely different from those requiring scheduled surgical interventions. Clinical data about the role of SEER technology in ICU patients, such as the correlation between SEER parameters and common coagulation laboratory values, still need to be thoroughly explored.
- Objectives
- This preliminary retrospective cohort study aimed to analyze the relationship between the SEER parameters provided by the Quantra device and the coagulation values obtained from standard venous blood samples in patients requiring ICU admission.
INTRODUCTION
- Ethics statement
- Due to the study's retrospective nature, we did not require approval from the local ethic committee. The requirement of informed consent was also waived due to the retrospective nature of the study. The study was conducted following the International Conference on Harmonization Good Clinical Practice Guideline and the provisions of the 2008 Declaration of Helsinki.
- Patient enrollment
- For this preliminary retrospective analysis, we reviewed medical charts of 13 adult patients admitted in our ICU (Azienda Ospedaliero Universitaria San Giovanni di Dio Ruggi d’Aragona, Salerno, Italy) in whom at least one VET coagulation study with Quantra was performed. Therapeutic interventions aimed to treat coagulation disorders were adopted only according to laboratory results.
- Patients’ data were anonymously collected on an electronic sheet (Microsoft Excel, Microsoft Corp). For every patient, we collected age, sex, body mass index, and the clinical reason for ICU admission. To stratify patients’ clinical conditions on admission, we calculated the Charlson Comorbidity Index, the Simplified Acute Physiology Score (SAPS) II [17], and the Glasgow Coma Scale (GCS) [18].
- Blood samples
- Whole blood samples were drawn from central or peripherical venous catheters. The catheters from which blood samples were drawn were not coated with anticoagulant, nor was heparin used in the flush system. To avoid contamination with the flush system, all venous samples were obtained after the withdrawal of 10 mL of blood, corresponding to roughly three times the dead space volume of the catheter.
- The following parameters were noted: platelet count (PLT), international normalized ratio (INR), prothrombin activity (PT; expressed as a percentage), activated partial thromboplastin time (aPTT; expressed in seconds), and fibrinogen. Within 30 minutes after the routine venous blood samples were taken, another venous blood sample was performed and tested with the Quantra in combination with the QStat Cartridge (HemoSonics). The QStat Cartridge was designed to evaluate hemostatic function in trauma, liver transplantation, and other critical care settings, providing the following parameters [9]: (1) clot time (CT; normal range, 113 to 164 seconds) in citrated whole blood, measured with activation of the intrinsic pathway activated by kaolin; (2) clot stiffness (CS; normal range, 13.0 to 33.2 hPa) of the whole blood, measured with activation of the extrinsic pathway by thromboplastin and heparin inhibition by polybrene and expressed as hectopascals; fibrinogen contribution to CS (FCS; normal range, 1.0 to 3.7 hPa), measured with activation of the extrinsic pathway by thromboplastin, heparin inhibition by polybrene, and platelet inhibition by abciximab, representing the contribution of functional fibrinogen to overall CS; (3) platelet contribution to CS (PCS; normal range, 11.9 to 29.8 hPa), calculated as the difference between CS and FCS, representing the contribution of platelet activity to overall clot stiffness; and (4) clot stability to lysis within 15 minutes (normal range, 93% to 100%), calculated by normalizing the rate of stiffness reduction observed with thromboplastin activation to the corresponding change CS observed with thromboplastin activation and tranexamic acid, representing the reduction in clot stiffness related to fibrinolysis.
- Statistical analysis
- Statistical analysis was performed with RStudio Posit team 2022 (RStudio). Categorical variables were reported as absolute values and percentages, while continuous data were reported as median (first and third quartile) and minimum and maximum values. In case of missing data, statistics were computed with available values. The relationship between Quantra and laboratory results was analyzed with the Spearman rank correlation coefficient (rho), and the 95% confidence interval (CI) was computed.
- In detail, we explored the following relationships: (1) coagulation intrinsic pathway (the relationship between CT and aPTT); (2) coagulation extrinsic pathway (the relationship of CS with INR and PT); (3) platelet (the relationship between PCS and PLT); (4) fibrinogen (the relationship between FCS and fibrinogen). The magnitude of the observed rho values was interpreted as follows: negligible (0≤rho<0.10), weak (0.10≤rho≤0.39), moderate (0.39<rho≤0.69), strong (0.69<rho≤0.89), and very strong (0.89<rho≤1.00) [19]. A P-value<0.05 was considered statistically significant. Further analysis was performed according to the results. The results are reported in tables and scatterplots.
METHODS
- From the 13 ICU patients, we collected 28 laboratory and Quantra samples. Patients’ main characteristics, together with laboratory and Quantra results, are presented in Table 1. Regarding the reason for ICU admission, seven patients (53.8%) were admitted due to trauma, three (23.1%) required postsurgical monitoring, and three (23.1%) had experienced stroke.
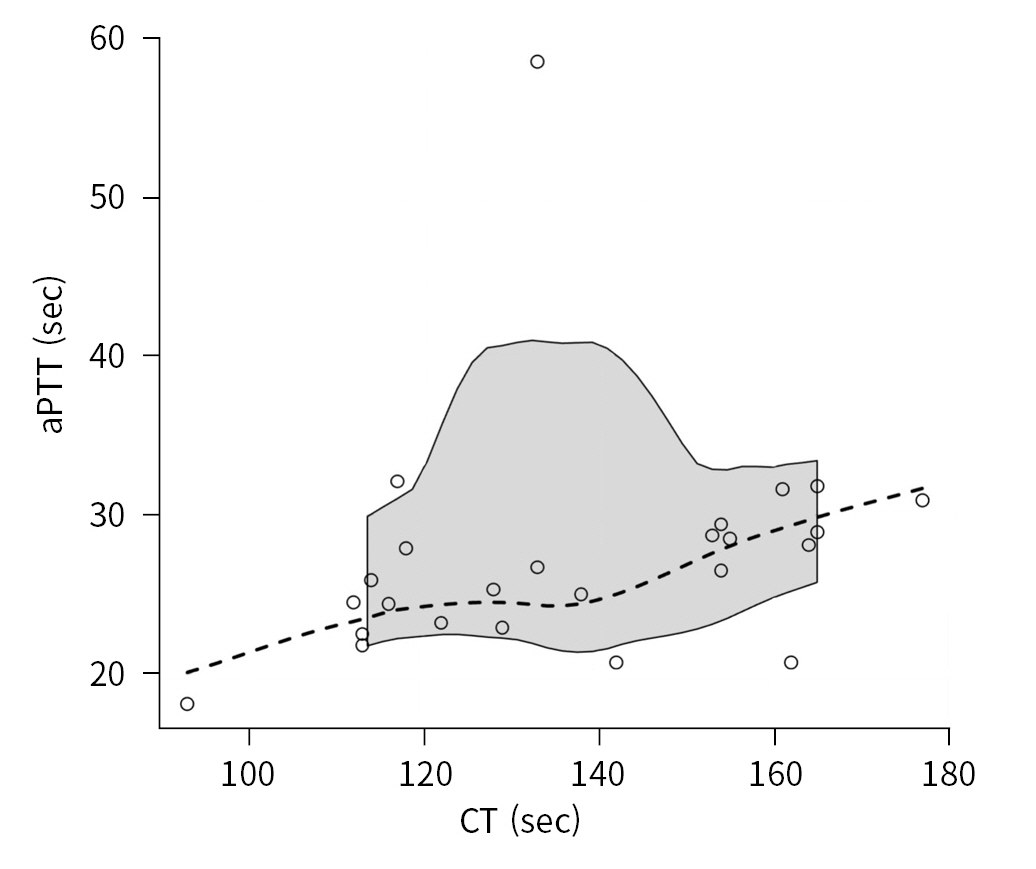
- Coagulation intrinsic pathway
- The intrinsic coagulation pathway was explored by examining the relationship between CT and aPTT (25 data pairs). The magnitude of the relationship was moderate, and the correlation was statistically significant, with a rho coefficient equal to 0.516 (95% CI, 0.123 to 0.904; P=0.009) (Fig. 1).
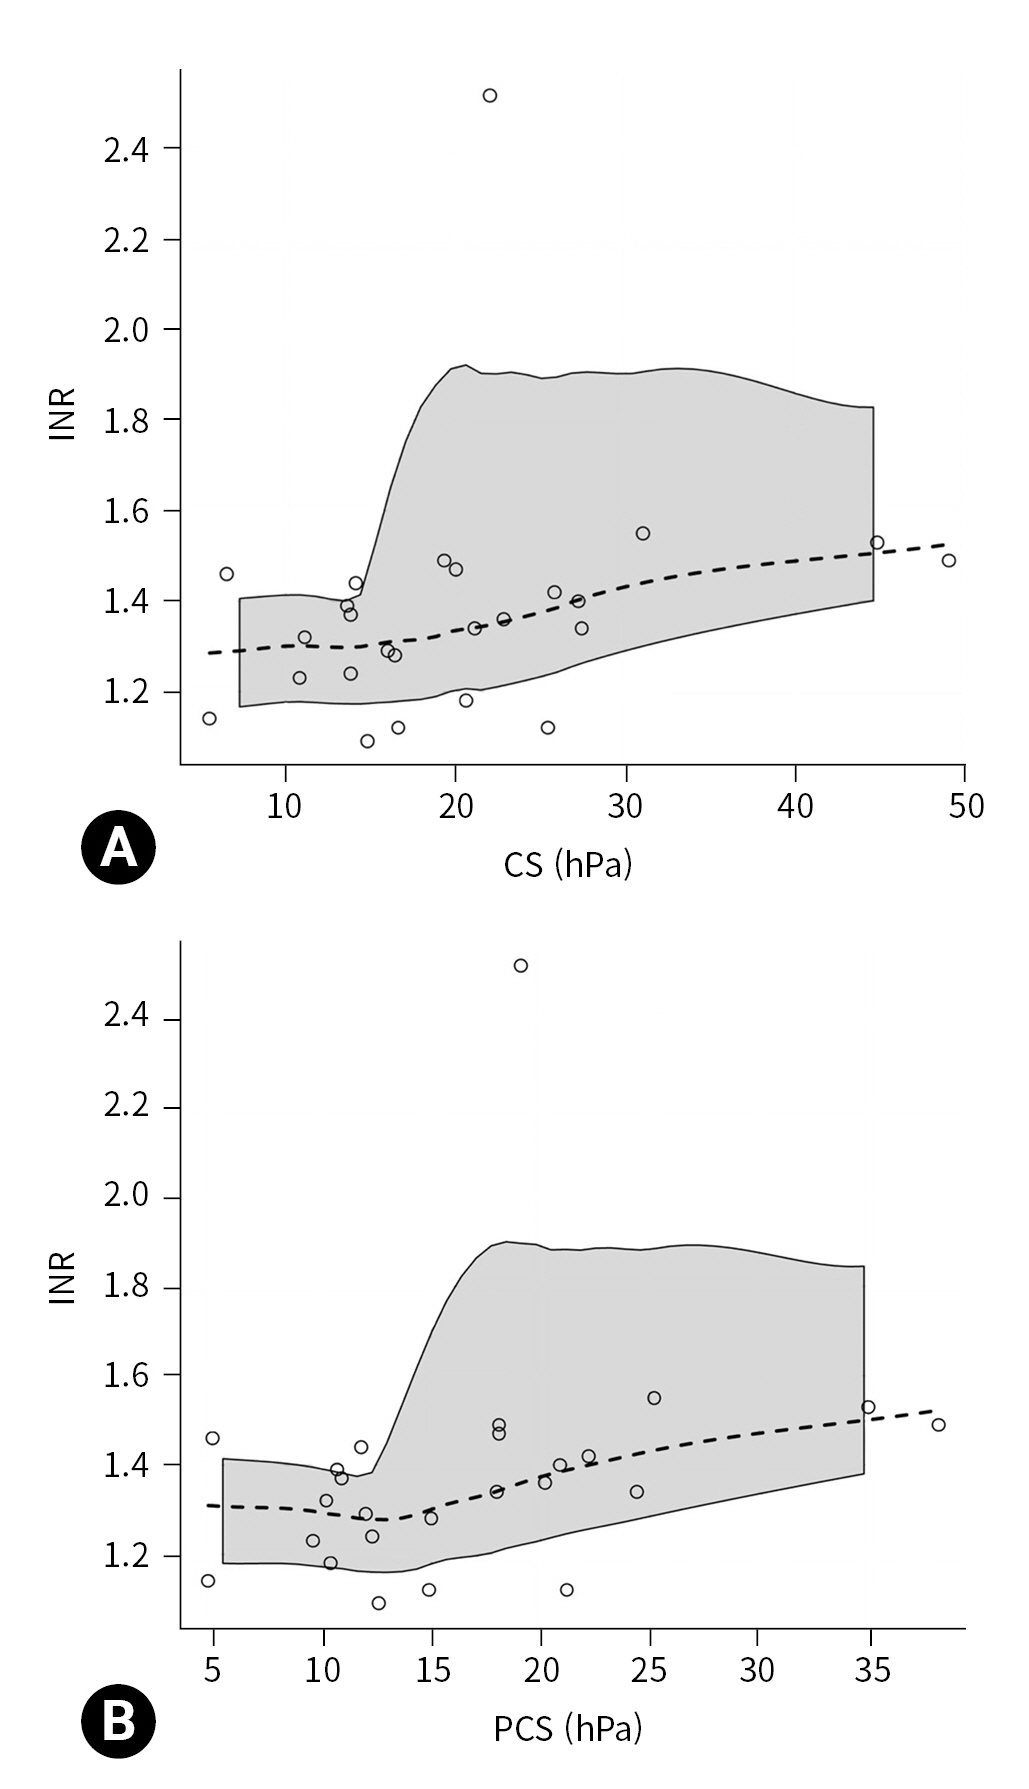
- Coagulation extrinsic pathway
- The extrinsic coagulation pathway was explored by examining the relationship between CS, INR, and PT. The relationship between CS and INR (25 data pairs) was statistically significant (P=0.039), with a moderate magnitude (rho=0.418; 95% CI, 0.042 to 0.787) (Fig. 2A). The relationship between CS and PT (25 data pairs) was not statistically significant (rho=–0.376; 95% CI, –0.770 to 0.023; P=0.065).
- Because CS is used to compute PCS, we also explored the relationship of INR with PCS and FCS. The relationship between INR and PCS (25 data pairs) was statistically significant (P=0.022), with a moderate magnitude (rho=0.459; 95% CI, 0.077 to 0.836) (Fig. 2B), while the relationship between INR and FCS (25 data pairs) was not significant (rho=0.288; 95% CI, –0.154 to 0.724; P=0.163).
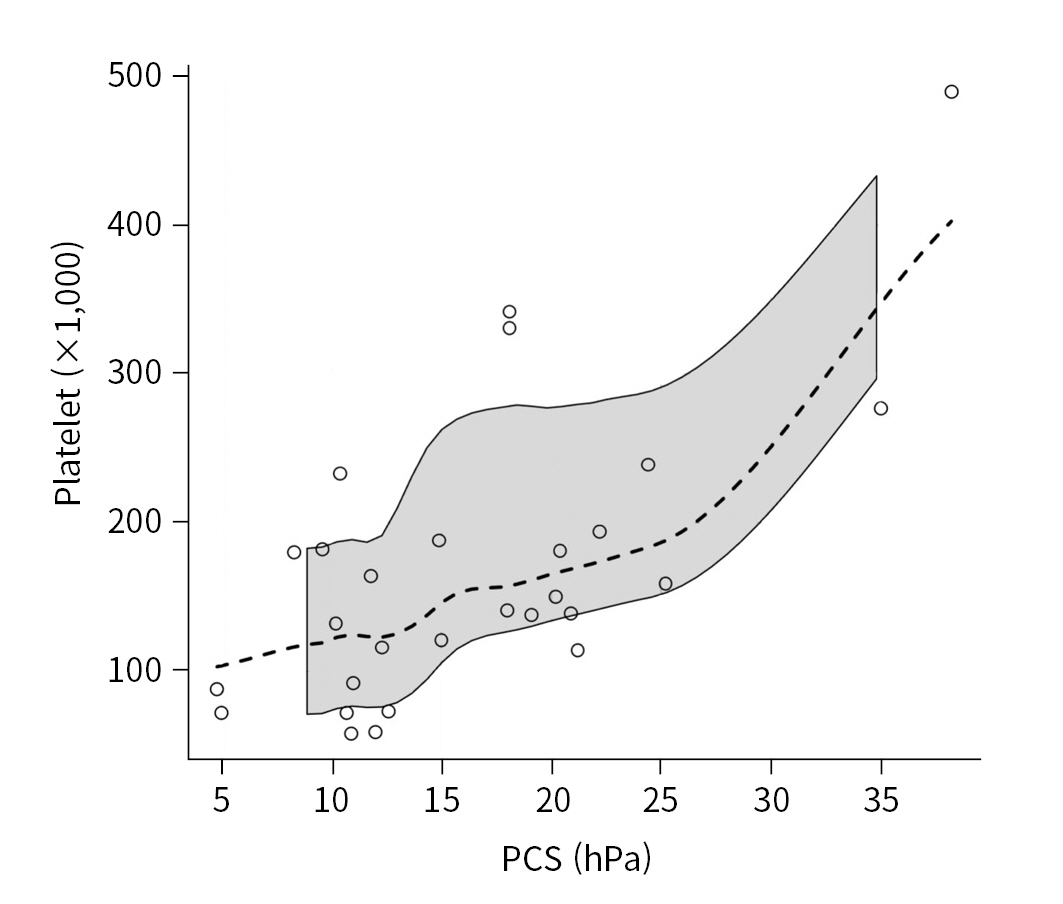
- Platelets
- The relationship between platelet count and PCS (28 data pairs) was statistically significant (P=0.008) with moderate magnitude (rho=0.498; 95% CI, 0.166 to 0.825) (Fig. 3).
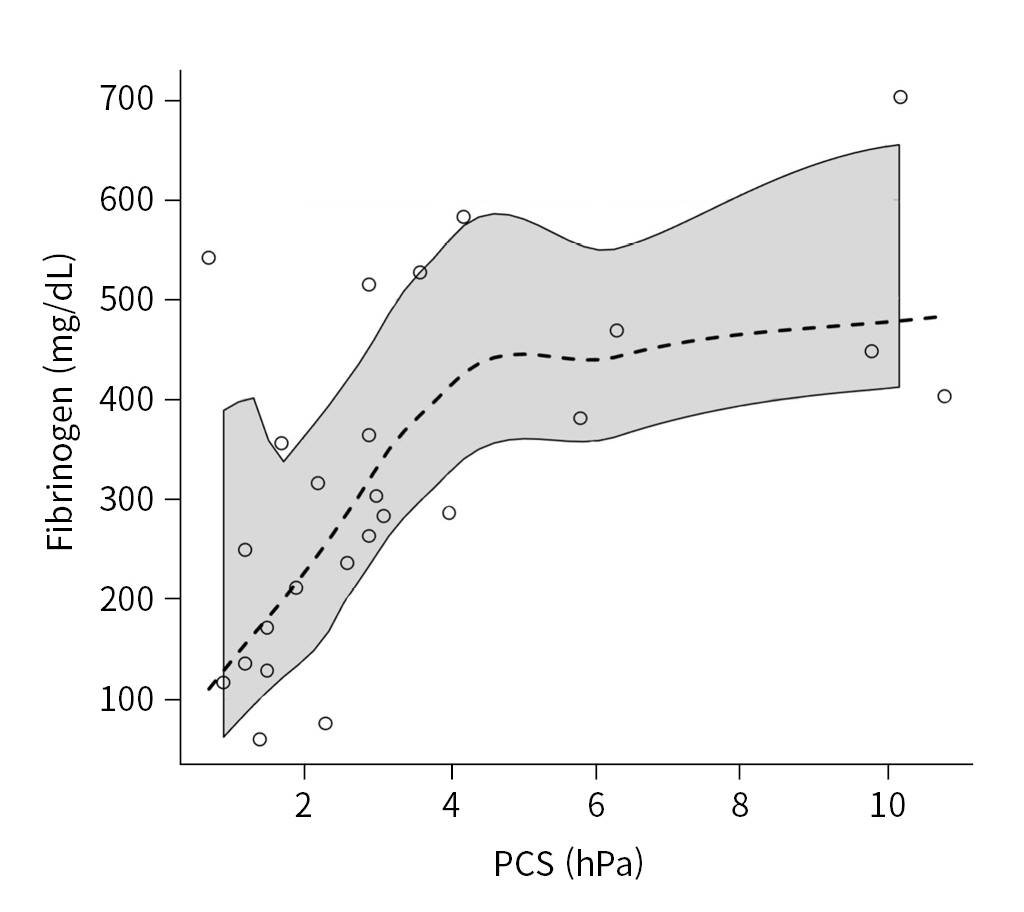
- Fibrinogen
- Fibrinogen showed a statistically significant, moderate relationship with FCS (25 data pairs), with a rho coefficient of 0.620 (95% CI, 0.081 to 0.881; P=0.001) (Fig. 4).
RESULTS
- Quantra is based on SEER technology and has been designed and optimized for ease of use, automation, and rapid turnaround time to enable utilization at the point of care. Furthermore, SEER technology does not require moving mechanical components to be in direct contact with the whole blood sample being measured, thus overcoming the limitations of TEG and ROTEM technology [6]. Quantra has been studied in various surgical settings, with encouraging results and good correlations with standard VET devices and common laboratory test results [10–16].
- However, patients requiring ICU admission, especially trauma patients, represent a different population than those requiring scheduled surgery. First, patients undergoing surgery discontinue drugs that alter platelet aggregation and coagulation before surgery. Second, during surgery, bleeding events are predictable, preventable, and can be promptly treated. Third, during surgery, parameters that can modify the coagulation cascade, such as body temperature, calcium levels, and the volume of liquids infused, are well monitored and correctable. On the contrary, patients requiring ICU admission may present numerous coagulation alterations due to the intake of anticoagulant and antiplatelet drugs, hypocalcemia, uncontrolled administration of fluids to reach adequate hemodynamic parameters, and hypothermia [2]. All these factors could invalidate the results obtained by Quantra in surgical settings.
- In our preliminary study, performed in patients requiring ICU admission, we found that Quantra parameters moderately correlated with traditional laboratory tests, providing data about coagulation intrinsic and extrinsic pathways, platelet count, and fibrinogen concentration.
- Even if data exploring the relationship between Quantra and common laboratory values in patients requiring critical care are still scares, our results are in line with those obtained in surgical settings. We found that aPTT showed a statistically significant moderate correlation with CT, suggesting to clinicians when clotting factors should be administered during bleeding [9].
- However, the findings in the literature about the relationship between aPTT and CT are discordant. A prospective cohort study in cardiac surgery (30 patients) performed by Baryshnikova et al. [10] found that the correlation between the CT provided by Quantra and the aPTT values was negligible, while Huffmyer et al. [16], in a prospective observational study performed on 55 patients undergoing elective cardiac surgery, found a better correlation. In noncardiac surgical settings, Idowu et al. [12], in a prospective nonrandomized observational study performed on 74 adults undergoing oncologic surgery with an anticipated blood loss of more than 500 mL, found that the correlation coefficients between conventional laboratory tests and Quantra ranged from 0.74 to 0.83, indicating moderate correlations (P<0.001).
- We found that Quantra was able to explore the extrinsic coagulation pathway, with a statistically significant relationship between CS and INR. Our study found that INR values can modify the CS parameter, generating misinterpretation. According to this finding, we also observed that INR showed a moderate correlation with PCS but not with FCS. To the best of our knowledge, no previous studies have explored these relationships.
- Generally, an increase in INR is typical of hypocoagulable states with multiple coagulation factor deficiencies. Although our results should be interpreted cautiously, an increase in the INR value can be associated with an increase in the CS value, altering the PCS value. PCS represents the contribution of platelet activity to overall clot stiffness and is an indirect parameter calculated as the difference between CS and FCS. This phenomenon partly explains the moderate correlation between platelet count and PCS found in our and other studies [10,16]. Huffmyer et al. [16] concluded that a possible explanation for the moderate correlation with platelet count is that the PCS value considers not only the platelet number, but also the ability of platelets to contract and interact with the polymerized fibrin. In contrast, the laboratory platelet count considers only a single dimension, with no functional information. Although it was reported that the PCS parameter was independently associated with platelet count and adenosine diphosphate–dependent platelet function, as measured by multiple electrode aggregometry [10], this issue deserves to be analyzed in further studies that consider the value of the INR and its ability to alter the CS. Patients with high INR and low fibrinogen values can present normal or high PCS values even with a low platelet count, causing misinterpretation of the results and delaying the administration of the platelet pool in emergency conditions.
- In our study, fibrinogen showed a statistically significant moderate relationship magnitude with FCS, suggesting a role to guide the prompt fibrinogen administration when required. The data in the literature are discordant regarding the role of Quantra in guiding the administration of blood products to correct acquired coagulopathies. Zghaibe et al. [14], in a prospective cohort study performed on 52 patients undergoing urgent cardiac surgery, found a high negative predictive value for Quantra parameters, suggesting that Quantra may be useful for demonstrating when coagulation is normal, and bleeding is probably related to surgical causes. Meanwhile, the low positive predictive value may not accurately indicate when blood component therapy is required and what components should be administered. Contrarily, Naik et al. [11], in a multicenter, prospective observational study (163 subjects undergoing cardiac bypass surgery, 79 subjects undergoing major orthopedic surgery, and five patients presenting with acute bleeding) showed that the FCS and PCS parameters reported by Quantra could reliably predict most critical levels of hypofibrinogenemia and thrombocytopenia.
- We want to emphasize that the present preliminary study analyzed for the first time the relationship between laboratory data and those obtained by Quantra in patients requiring ICU admission. Furthermore, we provide findings regarding possible interference with Quantra parameters (especially CS and PCS) by INR values, which has not been previously reported in the literature.
- Limitations
- This study had some limitations. First, we could not perform further statistical elaborations due to its retrospective nature and the small sample size. Second, our study was heterogeneous regarding the reasons for ICU admission (only seven patients for trauma). Third, multiple samples were obtained from the same patients during their ICU stay, and we did not perform a trend analysis. Fourth, due to the small sample size, we did not explore the performance of Quantra for low coagulation parameter values. Fifth, the lack of data in the literature about the role of Quantra values in patients requiring ICU admission limits our discussion to the results obtained in surgical settings.
- Conclusions
- Quantra, a device based on SEER technology, can provide useful information regarding patients’ coagulation status with a modest correlation with the parameters obtained from laboratory tests. In detail, during diffuse bleeding, CT and FCS values can guide the proper administration of clotting factors and fibrinogens. However, it is still unclear if therapy guided by SEER technology can prompt correct coagulation disorders in acute and critical illnesses, influencing clinical outcomes. Moreover, the correlation of INR with CS and PCS can cause misinterpretation of the results. Further studies are needed to clarify the relationship between Quantra parameters and laboratory tests in the critical care setting and the role of SEER technology in guiding targeted therapies and improving outcomes.
DISCUSSION
-
Conflicts of interest
The authors have no conflicts of interest to declare.
-
Funding
The authors did not receive any financial support for this study.
-
Data availability
Data of this study are available from the corresponding author upon reasonable request.
-
Author contributions
Conceptualization: AR, RG, AC; Data curation: AR, AC, AS; Formal analysis: AR, RG, SP; Methodology: AR, AC, SP; Project administration: RG; Visualization: AC, SP, AS; Writing–original draft: AR, AC, SP, AS; Writing–review & editing: all authors. All authors read and approved the final manuscript.
ARTICLE INFORMATION


| Characteristic | Value | Rangea) |
|---|---|---|
| Male sex | 8 (61.5) | - |
| Age (yr) | 59.0 (36.0–69.0) | 21.0–88.0 |
| Body mass index (kg/m2) | 26.1 (24.2–29.4) | 22.5–44.1 |
| Charlson Comorbidity Index | 3.0 (0–3.0) | 0–5.0 |
| Simplified Acute Physiology Score II | 59.0 (49.0–75.0) | 34.0–78.0 |
| Glasgow Coma Scale | 9.0 (6.0–13.0) | 5.0–14.0 |
| Reason for ICU admission | ||
| Trauma | 7 (53.8) | - |
| Postsurgical monitoring | 3 (23.1) | - |
| Stroke | 3 (23.1) | - |
| Coagulation parameter | ||
| Platelets (103) | 145.5 (108.5–189.5) | 58.0–490.0 |
| International normalized ratiob) | 1.36 (1.24–1.46) | 1.09–2.52 |
| Prothrombin activity (%)b) | 67.0 (61.0–75.0) | 33.0–90.0 |
| Activated partial thromboplastin time (sec)b) | 26.5 (23.2–28.9) | 18.1–58.5 |
| Fibrinogen (mg/dL)b) | 303.0 (211.0–448.0) | 59.0–703.0 |
| Quantra parameter | ||
| Clot time (sec) | 131.5 (116.8–154.2) | 93.0–177.0 |
| Clot stiffness (hPa) | 17.9 (13.7–23.9) | 5.5–49.0 |
| Fibrinogen contribution to clot stiffness (hPa) | 2.7 (1.5–3.7) | 0.7–10.8 |
| Platelet contribution to clot stiffness (hPa) | 14.9 (10.8–20.5) | 4.8–38.2 |
| Clot stability to lysis | 0.99 (0.99–1.00) | 0.96–1.00 |
- 1. Curry NS, Davenport R. Transfusion strategies for major haemorrhage in trauma. Br J Haematol 2019;184:508–23. ArticlePubMedPDF
- 2. Moore EE, Moore HB, Kornblith LZ, et al. Trauma-induced coagulopathy. Nat Rev Dis Primers 2021;7:30. ArticlePubMedPMCPDF
- 3. Mitra S, Ling RR, Yang IX, et al. Severe COVID-19 and coagulopathy: a systematic review and meta-analysis. Ann Acad Med Singap 2021;50:325–35. ArticlePubMed
- 4. Heubner L, Mirus M, Vicent O, et al. Point of care coagulation management in anesthesiology and critical care. Minerva Anestesiol 2022;88:615–28. ArticlePubMed
- 5. Ganter MT, Hofer CK. Coagulation monitoring: current techniques and clinical use of viscoelastic point-of-care coagulation devices. Anesth Analg 2008;106:1366–75. ArticlePubMed
- 6. Burghardt WR, Goldstick TK, Leneschmidt J, Kempka K. Nonlinear viscoelasticity and the thrombelastograph: 1. Studies on bovine plasma clots. Biorheology 1995;32:621–30. ArticlePubMed
- 7. Corey FS, Walker WF. Sonic estimation of elasticity via resonance: a new method of assessing hemostasis. Ann Biomed Eng 2016;44:1405–24. ArticlePubMedPMCPDF
- 8. Ferrante EA, Blasier KR, Givens TB, Lloyd CA, Fischer TJ, Viola F. A novel device for the evaluation of hemostatic function in critical care settings. Anesth Analg 2016;123:1372–9. ArticlePubMedPMC
- 9. Allen TW, Winegar D, Viola F. The Quantra system and SEER sonorheometry. In: Moore HB, Neal MD, Moore EE, editors. Trauma induced coagulopathy. Springer; 2021. p. 693–704.
- 10. Baryshnikova E, Di Dedda U, Ranucci M. A comparative study of SEER sonorheometry versus standard coagulation tests, rotational thromboelastometry, and multiple electrode aggregometry in cardiac surgery. J Cardiothorac Vasc Anesth 2019;33:1590–8. ArticlePubMed
- 11. Naik BI, Tanaka K, Sudhagoni RG, Viola F. Prediction of hypofibrinogenemia and thrombocytopenia at the point of care with the Quantra® QPlus® System. Thromb Res 2021;197:88–93. ArticlePubMed
- 12. Idowu O, Ifeanyi-Pillette I, Owusu-Agyemang P, et al. The Quantra hemostasis analyzer compared to thromboelastography (TEG) in the surgical oncologic population: a prospective observational trial. J Surg Oncol 2021;124:894–905. ArticlePubMedPDF
- 13. Baulig W, Akbas S, Schutt PK, et al. Comparison of the resonance sonorheometry based Quantra® system with rotational thromboelastometry ROTEM® sigma in cardiac surgery: a prospective observational study. BMC Anesthesiol 2021;21:260. ArticlePubMedPMCPDF
- 14. Zghaibe W, Scheuermann S, Munting K, et al. Clinical utility of the Quantra® point-of-care haemostasis analyser during urgent cardiac surgery. Anaesthesia 2020;75:366–73. ArticlePubMedPDF
- 15. Groves DS, Welsby IJ, Naik BI, et al. Multicenter evaluation of the Quantra QPlus System in adult patients undergoing major surgical procedures. Anesth Analg 2020;130:899–909. ArticlePubMed
- 16. Huffmyer JL, Fernandez LG, Haghighian C, Terkawi AS, Groves DS. Comparison of SEER sonorheometry with rotational thromboelastometry and laboratory parameters in cardiac surgery. Anesth Analg 2016;123:1390–9. ArticlePubMed
- 17. Le Gall JR, Lemeshow S, Saulnier F. A new Simplified Acute Physiology Score (SAPS II) based on a European/North American multicenter study. JAMA 1993;270:2957–63. ArticlePubMed
- 18. Reith FC, Van den Brande R, Synnot A, Gruen R, Maas AI. The reliability of the Glasgow Coma Scale: a systematic review. Intensive Care Med 2016;42:3–15. ArticlePubMedPDF
- 19. Mukaka MM. Statistics corner: a guide to appropriate use of correlation coefficient in medical research. Malawi Med J 2012;24:69–71. PubMedPMC
 PubReader
 ePub Link
 Cite
Cite